- Email support@dumps4free.com

Topic 4, Misc. Questions
You use an R visual to produce a map of 500,000 customers. You include the values of
CustomerID, Latitude, and Longitude in the fields sent to the visual. Each customer ID is
unique.
In powerbi.com, when users load the visual, they only see some of the customers.
What is the cause of the issue?
A.
The visual was built by using a different version of R.
B.
The data comes from a Microsoft SQL Server source.
C.
The data is deduplicated.
D.
Too many records were sent to the visual.
Too many records were sent to the visual.
Explanation:
R visuals in the Power BI service have a few limitations including:
Data size limitations – data used by the R visual for plotting is limited to 150,000
rows. If more than 150,000 rows are selected, only the top 150,000 rows are used
and a message is displayed on the image. Additionally, the input data has a limit of
250 MB.
Reference:
https://docs.microsoft.com/en-us/power-bi/visuals/service-r-visuals
You have sales data in a star schema that contains four tables named Sales, Customer,
Date, and Product.
The Sales table contains purchase and ship dates.
Most often, you will use the purchase date to analyze the data, but you will analyze the
data by both dates independently and together.
You need to design an imported dataset to support the analysis. The solution must
minimize the model size and the number of queries against the data source.
Which data modeling design should you use?
A.
Use the Auto Date/Time functionality in Microsoft Power BI and do NOT import the Date table.
B.
Duplicate the Date query in Power Query and use active relationships between both Date tables.
C.
On the Date table, use a reference query in Power Query and create active relationships between Sales and both Date tables in the modeling view.
D.
Create an active relationship between Sales and Date for the purchase date and an
inactive relationship for the ship date
Create an active relationship between Sales and Date for the purchase date and an
inactive relationship for the ship date
Explanation:
Only one relationship can be active.
Note: If you query two or more tables at the same time, when the data is loaded, Power BI
Desktop attempts to find and create relationships for you. The relationship options
Cardinality, Cross filter direction, and Make this relationship active are automatically set.
Reference:
https://docs.microsoft.com/en-us/power-bi/transform-model/desktop-create-and-managerelationships
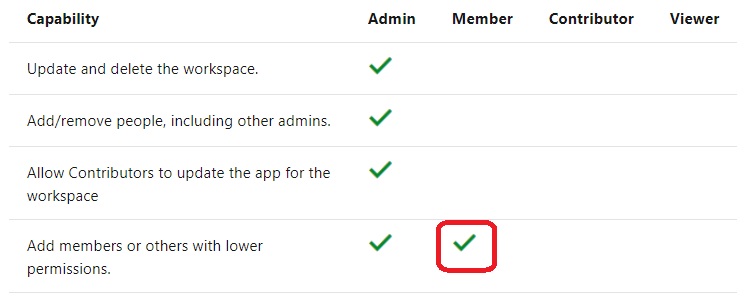
You need to provide a user with the ability to add members to a workspace. The solution must use the
principle of least privilege.
Which role should you assign to the user?
A.
Viewer
B.
Contributor
C.
Member
D.
Admin
Member
You plan to develop a Power BI report that has a bar chart to display the number of
customers by location. You have a table named Customer that has the following columns:
• Customer ID
• CustomerName
• Address
• City
• ProvState
• Country
You need to allow users to drill down by location. The report will display the number of
each customer by Country, and drill down to ProvState, and then to City. How should you
configure the drill down in the bar chart?
A.
In the Value field, add Country. In the Legend field, add ProvState at the top, followed by City.
B.
In the Legend field, add Country. In the Axis field, add ProvState at the top, followed by City.
C.
In the Axis field, add Country at the top, followed by ProvState, and then City.
D.
In the Value field, add Country at the top, followed by ProvState, and then City.
In the Axis field, add Country at the top, followed by ProvState, and then City.
Explanation: References:
https://docs.microsoft.com/en-us/power-bi/guided-learning/visualizations#step-18
https://docs.microsoft.com/en-us/power-bi/power-bi-visualization-drill-down
Your organization has a team of power users who recently created 20 Power BI
dashboards.
The power users share the dashboards with other users in the organization.
When the users attempt to access the dashboards, they receive the error message shown
in the exhibit. (Click the Exhibit.)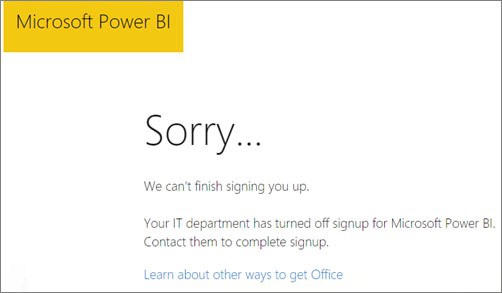
What should you do first?
A.
From the Microsoft Office 365 Admin center, and the Power BI (free) subscription, and then assign a license to each user.
B.
From the Power BI Admin portal, modify the Privacy Settings.
C.
From the properties of each dashboard, modify the Share dashboard settings.
D.
Instruct each user to install Microsoft Office 2016.
From the Microsoft Office 365 Admin center, and the Power BI (free) subscription, and then assign a license to each user.
Explanation:
References: http://www.nubo.eu/en/blog/2016/12/Enable-PowerBI-On-Office-365/
| Page 7 out of 58 Pages |
| Previous |