- Email support@dumps4free.com

Topic 3, Northwind Traders
Case study
This is a case study. Case studies are not timed separately. You can use as much
exam time as you would like to complete each case. However, there may be additional
case studies and sections on this exam. You must manage your time to ensure that you
are able to complete all question included on this exam in the time provided.
To answer the questions included in a case study, you will need to reference information
that is provided in the case study. Case studies might contain exhibits and other resources
that provide more information about the scenario that is described in the case study. Each
question is independent of the other question on this case study.
At the end of this case study, a review screen will appear. This screen allows you to review
your answers and to make changes before you move to the next section of the exam. After
you begin a new section, you cannot return to this section.
To start the case study
To display the first question on this case study, click the Next button. Use the buttons in the
left pane to explore the content of the case study before you answer the questions. Clicking
these buttons displays information such as business requirements, existing environment,
and problem statements. If the case study has an All Information tab, note that the
information displayed is identical to the information displayed on the subsequent tabs.
When you are ready to answer a question, click the Question button to return to the
question.
Overview. General Overview
Northwind Traders is a specialty food import company.
The company recently implemented Power BI to better understand its top customers,
products, and suppliers.
Overview. Business Issues
The sales department relies on the IT department to generate reports in Microsoft SQL
Server Reporting Services (SSRS). The IT department takes too long to generate the
reports and often misunderstands the report requirements.
Existing Environment. Data Sources
Northwind Traders uses the data sources shown in the following table
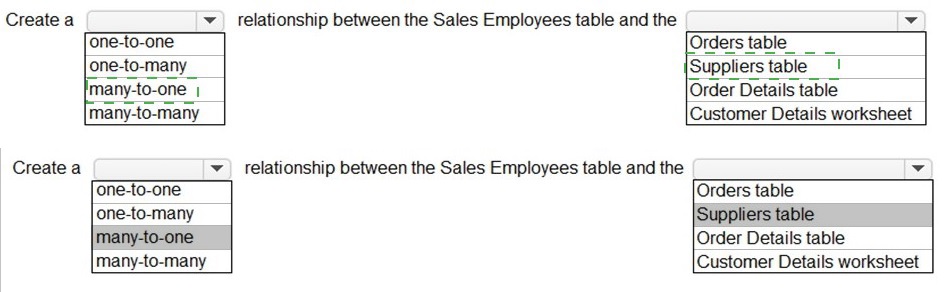
You need to create a relationship in the dataset for RLS.
What should you do? To answer, select the appropriate options in the answer area. NOTE: Each correct selection is worth one point.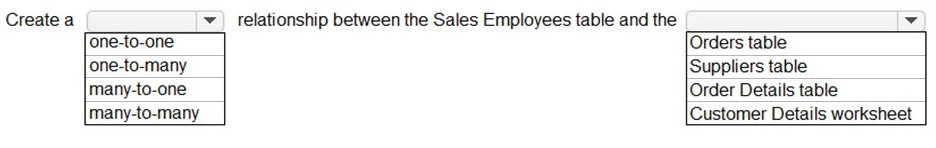
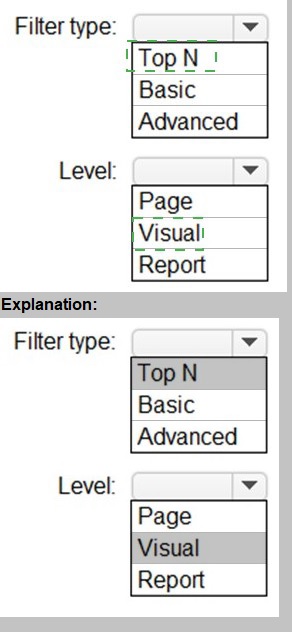
You need to create the Top Customers report.
Which type of filter should you use, and at which level should you apply the filter? To answer, select the appropriate options in the answer area.
NOTE: Each correct selection is worth one point.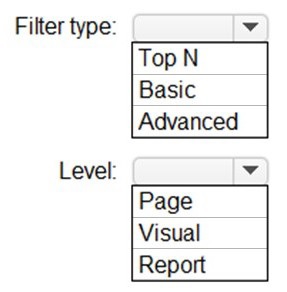
You need to create the On-Time Shipping report. The report must include a visualization that shows the percentage of late orders.
Which type of visualization should you create?
A.
bar chart
B.
scatterplot
C.
pie chart
bar chart
Explanation:
Scenario: The On-Time Shipping report will show the following metrics for a selected
shipping month or quarter:
The percentage of orders that were shipped late by country and shipping region
Customers that had multiple late shipments during the last quarter
Note: Bar and column charts are some of the most widely used visualization charts in
Power BI. They can be used for one or multiple categories. Both these chart types
represent data with rectangular bars, where the size of the bar is proportional to the
magnitude of data values.
The difference between the two is that if the rectangles are stacked horizontally, it is called
a bar chart. If the rectangles are vertically aligned, it is called a column chart.
Reference:
https://www.pluralsight.com/guides/bar-and-column-charts-in-power-bi
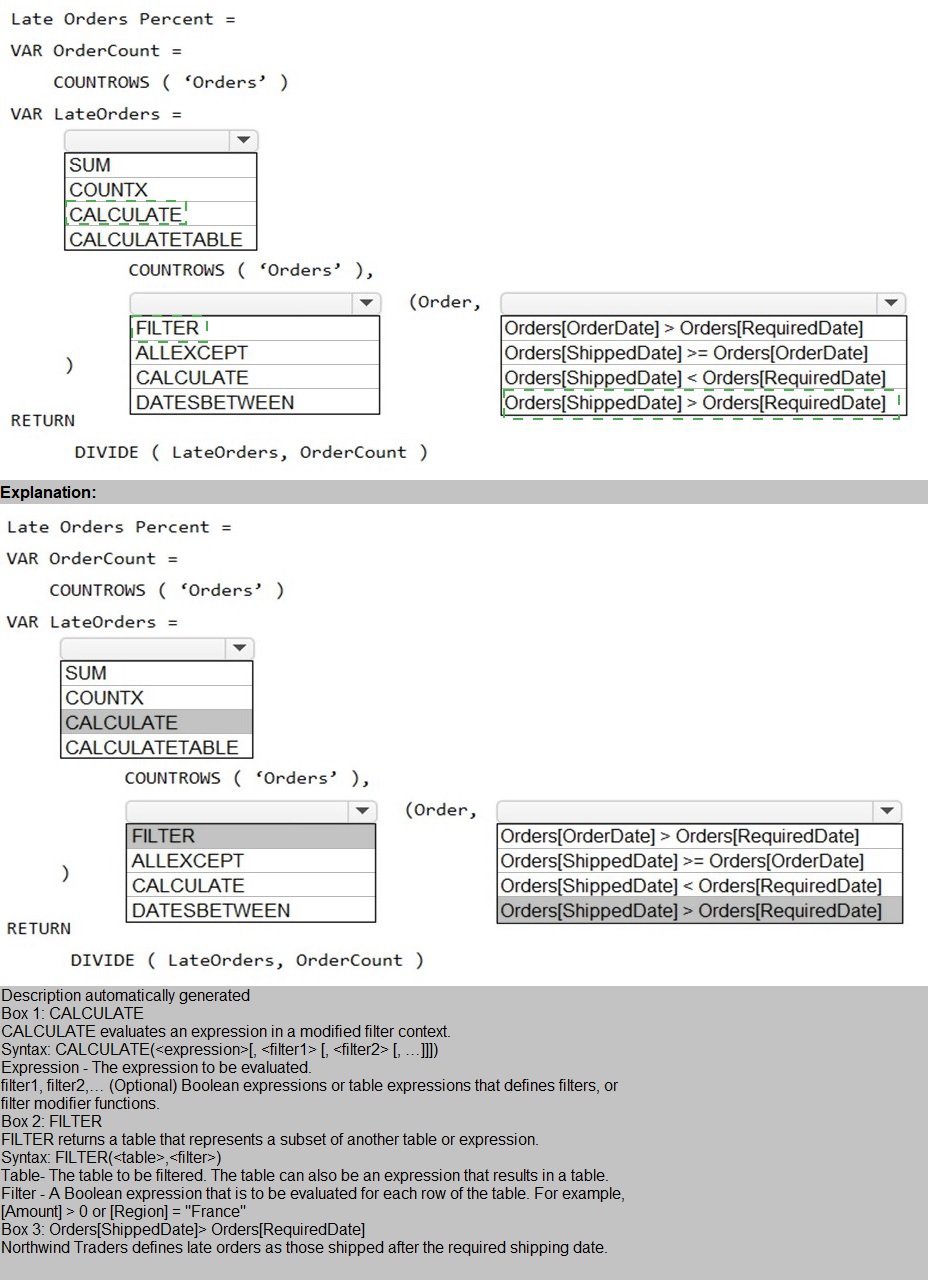
You need to create a measure that will return the percentage of late orders.
How should you complete the DAX expression? To answer, select the appropriate options
in the answer area.
NOTE: Each correct selection is worth one point.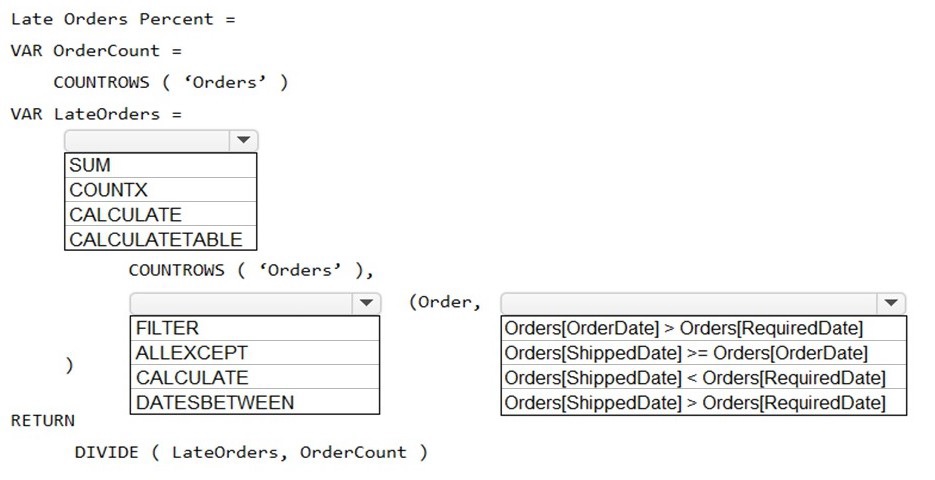
You need to configure access for the sales department users. The solution must me meet
the security requirements. What should you do?
A.
Add the sales department as a member of the reports workspace
B.
Add the Azure Active Directory group of the sales department as an Admin of the reports workspace.
C.
Distribute an app to the users in the Azure Active Directory group of the sales
department.
D.
Share each report to the Azure Active Directory group of the sales department
Share each report to the Azure Active Directory group of the sales department
| Page 5 out of 58 Pages |
| Previous |