- Email support@dumps4free.com

Topic 2, Contoso Ltd, Case Study
Overview
This is a case study. Case studies are not timed separately. You can use as much exam
time as you would like to complete each case. However, there may be additional case
studies and sections on this exam. You must manage your time to ensure that you are able
to complete all questions included on this exam in the time provided.
To answer the questions included in a case study, you will need to reference information
that is provided in the case study. Case studies might contain exhibits and other resources
that provide more information about the scenario that is described in the case study. Each
question is independent of the other questions in this case study.
At the end of this case study, a review screen will appear. This screen allows you to review
your answers and to make changes before you move to the next section of the exam. After
you begin a new section, you cannot return to this section.
To start the case study
To display the first question in this case study, click the Next button. Use the buttons in the
left pane to explore the content of the case study before you answer the questions. Clicking
these buttons displays information such as business requirements, existing environment
and problem statements. If the case study has an All Information tab, note that the
information displayed is identical to the information displayed on the subsequent tabs.
When you are ready to answer a question, click the Question button to return to the
question.
Existing Environment
Contoso, Ltd. is a manufacturing company that produces outdoor equipment Contoso has
quarterly board meetings for which financial analysts manually prepare Microsoft Excel
reports, including profit and loss statements for each of the company's four business units,
a company balance sheet, and net income projections for the next quarter.
Data and Sources
Data for the reports comes from three sources. Detailed revenue, cost and expense data
comes from an Azure SQL database. Summary balance sheet data comes from Microsoft
Dynamics 365 Business Central. The balance sheet data is not related to the profit and
loss results, other than they both relate to dates.
Monthly revenue and expense projections for the next quarter come from a Microsoft
SharePoint Online list. Quarterly projections relate to the profit and loss results by using the
following shared dimensions: date, business unit, department, and product category.
Net Income Projection Data
Net income projection data is stored in a SharePoint Online list named Projections in the
format shown in the following table.
Which DAX expression should you use to get the ending balances in the balance sheet reports?
A.
CALCULATE (
SUM( BalanceSheet [BalanceAmount] ),
DATESQTD( 'Date'[Date] )
)
B.
CALCULATE (
SUM( BalanceSheet [BalanceAmount] ),
LASTDATE( 'Date'[Date] )
)
C.
FIRSTNONBLANK ( 'Date' [Date]
SUM( BalanceSheet[BalanceAmount] )
)
D.
CALCULATE (
MAX( BalanceSheet[BalanceAmount] ),
LASTDATE( 'Date' [Date] )
)
CALCULATE (
SUM( BalanceSheet [BalanceAmount] ),
DATESQTD( 'Date'[Date] )
)
Explanation: Scenario: At least one of the balance sheet reports in the quarterly reporting
package must show the ending balances for the quarter, as well as for the previous
quarter.
DATESQTD returns a table that contains a column of the dates for the quarter to date, in
the current context.
Reference:
https://docs.microsoft.com/en-us/dax/datesqtd-function-dax
You need to recommend a strategy to consistently define the business unit, department,
and product category data and make the data usable across reports.
What should you recommend?
A.
Create a shared dataset for each standardized entity.
B.
Create dataflows for the standardized data and make the dataflows available for use in
all imported datasets.
C.
For every report, create and use a single shared dataset that contains the standardized
data.
D.
For the three entities, create exports of the data from the Power Bl model to Excel and
store the data in Microsoft OneDrive for others to use as a source.
Create dataflows for the standardized data and make the dataflows available for use in
all imported datasets.
Which two types of visualizations can be used in the balance sheet reports to meet the reporting goals? Each correct answer presents part of the solution.
NOTE: Each correct selection is worth one point.
A.
a line chart that shows balances by quarter filtered to account categories that are longterm
liabilities.
B.
a clustered column chart that shows balances by date (x-axis) and account category (legend) without
filters.
C.
a clustered column chart that shows balances by quarter filtered to account categories that are long-term liabilities.
D.
a pie chart that shows balances by account category without filters.
E.
a ribbon chart that shows balances by quarter and accounts in the legend
a line chart that shows balances by quarter filtered to account categories that are longterm
liabilities.
a ribbon chart that shows balances by quarter and accounts in the legend
Explanation: https://docs.microsoft.com/en-us/power-bi/visuals/power-bi-visualizationtypes-
for-reports-and-q-and-a
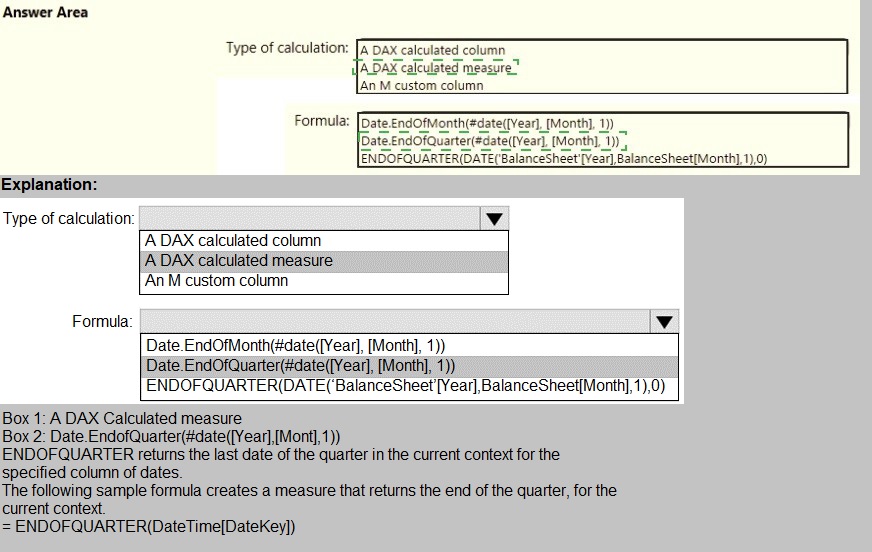
You need to calculate the last day of the month in the balance sheet data to ensure that you can relate the balance sheet data to the Date table. Which type of calculation and which formula should you use? To answer, select the appropriate options in the answer area. NOTE: Each correct selection is worth one point.

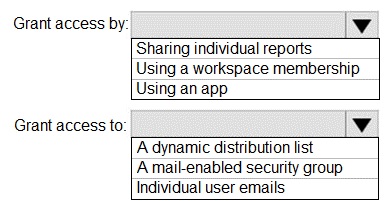
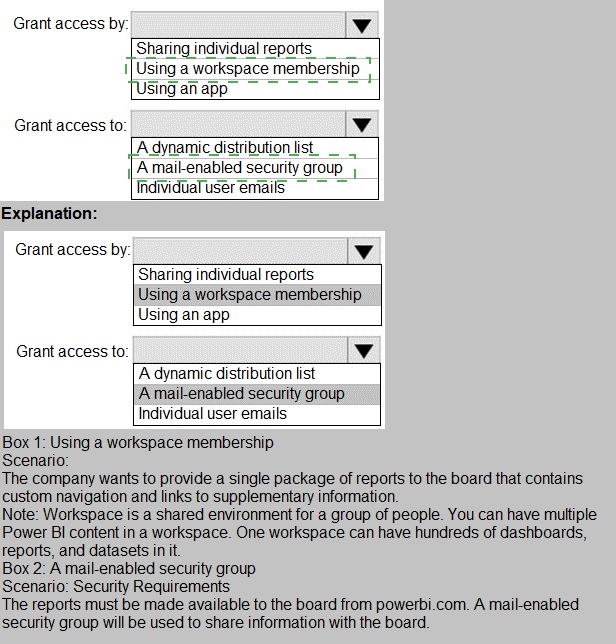
How should you distribute the reports to the board? To answer, select the appropriate
options in the answer area.
NOTE: Each correct selection is worth one point.

| Page 3 out of 58 Pages |
| Previous |